


Your Role In Abundance
This movement won't be real unless people like you make it real.

Speaking of roles in Abundance: OpenPhilanthropy is recruiting a Senior Program Officer to lead their “Abundance and Growth Fund,” which will invest $40m+ per year over the next 3 years into Abundance-aligned policy & movement-building work. This will be one of the most important positions in the Abundance ecosystem. Refer someone who would be a good fit or consider applying yourself!
The publication of Ezra Klein & Derek Thompson’s Abundance has the potential to mark the next phase of a generational reform movement.
The ideas in the book, and from the encompassing community of public intellectuals, are gaining traction, namely:
(1) We need more high-quality supply and lower prices for the building blocks of a good life;
and
(2) High-quality supply is constrained both because of capture by entrenched interests and because of weak state capacity / over-proceduralization.
Per a point Steve Teles recently made on The Realignment podcast (106 min), we should put the question of who produces and pays for the good (markets or government) second and focus first on why we have a scarcity of key goods. This shifts away from the old dividing line of politics—Big vs. Small government—toward something new. Perhaps: Which political coalition is geared toward Effective vs. Ineffective government?
Sizing The Work
In our view, the most important line in the book is this one: “to pursue Abundance is to pursue institutional renewal.”
Let’s step back and marvel at the enormity of the task.
We talk about “reforming government,” but there is not one US government. There are actually ~90,000 governments across federal (1), state (50), and local (~89,000). Local is subdivided into counties (3,000), municipalities (19,500), school districts (12,000) and special districts for services like water, transportation, and fire protection (38,500). There is no one-size-fits all solution.
Collectively our *governments* employ roughly 23 million people and operate on an annual budget of $10.8 trillion.
When we talk about the Abundance Movement, we are talking about the biggest change management project in history. While we often draw parallels to the Progressive Movement (11 min), the Progressives were largely building new institutions from scratch, whereas we will need to reform and renew existing structures.
Moreover, before we have the opportunity and democratic legitimacy to attempt to renew government, we have to win in politics. We need a set of elected political leaders who run on a platform of institutional renewal and have a mandate for change in the face of the deeply human bias for the status quo, which makes change difficult in any context, let alone one where there will be winners and losers in the short run and where entrenched interests have a vested interest in the system as it “works” today.
What might the totality of this reform effort look like in more detail? It will play out across a range of civic institutions, including but not limited to:
Electoral politics—Elected officials need to run and win on the Abundance ~ideology. We’ll know things are working when talented politicians want to pick up these ideas and use them because the ideas + the political infrastructure behind the ideas help them win. We think municipal governments are ground zero for this work, because cities are mostly one-party jurisdictions and much of their dysfunction reflects an absence of effective political competition, leading to capture of various sorts. Eventually quasi-party competition at the local level should flow up to the state and federal levels, where a cohered Abundance faction can challenge for power.
The administrative state—The 23m government employees we mentioned earlier comprise our actual governments. Per the phrase “personnel is policy,” what the leaders in these organizations have in their hearts and minds will determine the outcome of this project as much as any particular political campaign or elected official.
The courts—One way to frame the Abundance Movement is as a project to, in the words of the political scientist Stephen Skowronek, “build the next American state.” We’ve gone from the “Courts & Parties” system of Andrew Jackson to the “empowered Administrative State” of FDR to the “shackled state” of Nader & Reagan. The legal conservative movement was powered by decades of intellectual and advocacy work, enabled by a set of true believer funders. There will have to be a whole strand of our movement, led by folks like Nick Bagley, Alex Klass, and David Schleicher, to figure out the “Law of Abundance.”
Universities—Professors and students will need to be organized around Abundance to save universities from their current ideological cul-de-sac and to create pathways for political participation in the movement, as well as for ideas and expertise. An Abundance movement on campus can also help create the conditions to make high-quality higher education affordable and abundant, rather than an expensive zero-sum admissions game.
Philanthropy—We need to create networks of philanthropists who are committed to movement-building philanthropy within these different institutions, as well as connective tissue between them. We also need to help generate knowledge about how to do effective movement building philanthropy and rapid learning, and create prestige for doing this kind of work.
Across all of these institutions we need to build high-trust talent networks, programs to recruit folks into those networks, deeper intellectual work to flesh out the still nascent Abundance ideology, career tracks for young people, etc. In political venues we also need PACs, hard money bundling networks, vetted Abundant vendors across functions like comms, polling, campaign management, etc.
It’s a very big pile of work.
Case Study: YIMBYs in California
It’s so big, in fact, that it can be hard to see the whole elephant. So let’s look briefly at a concrete case study to wrap our heads around the scale of the problem: the YIMBY movement in California.
YIMBY is a tentpole issue for the Abundance Movement, not just because of the housing theory of everything, but also because (1) it’s a real life vs. thought leader-y movement that is starting to get results and (2) it contains within it a “moral core,” which Abundance draws from, namely that we can all give up a little individually to get a lot back collectively.
That said, it is still a single-issue political identity, which shrinks the surface area of complexity and political competition. And also we’re scoping down to just California.
Roughly a decade into the YIMBY movement in California, we have effectively won the war of ideas among elite opinion journalists1 and have laid the groundwork for material new outcomes in reality. But there are not yet “cranes in the sky.” The goal of the movement is to end the housing shortage in California, but annual production is well short of the 300-500k new units we need to be constructing to close the gap.
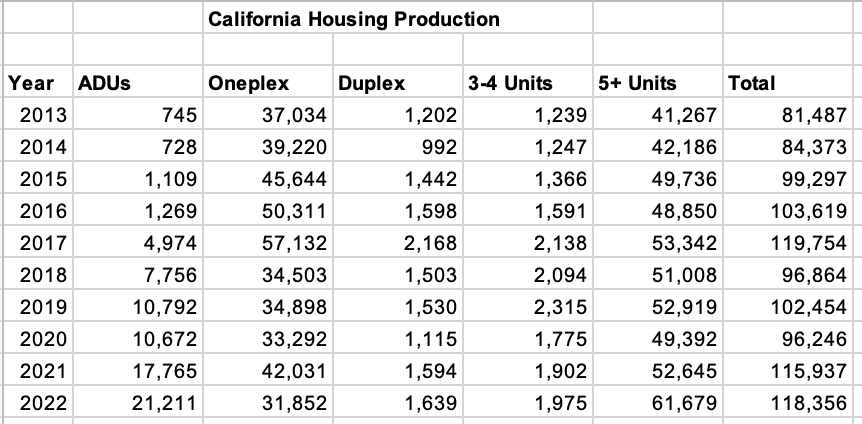
To be clear, that doesn’t mean YIMBYs aren’t making progress. There has been a sea-change in the politics around building, as well as a raft of laws passed over the last few legislative cycles. These laws, combined with new enforcement mechanisms, portend a housing boom in the coming years. There have also been some macro factors—e.g. rising interest rates, increased construction costs, and labor shortages—that have contributed to the construction lull over the past few years.2
What could have accelerated YIMBY outcomes? More resources!
YIMBY work is *massively* under-resourced in California.
As we explain in this video (5 min at 1.5x), outcomes are expensive as there are many places you need to fight simultaneously. Money can be used to engage in these fights per the framework below.

If you do napkin math on the total budget of pro-housing advocates in the state across these buckets, it is *tiny* relative to the value of the public problem they are attempting to solve.3
Below is a very rough guesstimate of pro-housing advocacy spend in California:

Think of all the human misery caused by homelessness, extreme rent burden, super commutes, etc. And what we as Californians are collectively throwing at that problem is approximately $20m annually.
YIMBYs have a long list of high-ROI projects they’d like to fund—everything from technical assistance for planning departments to a ballot measure to overturn Prop 13—but they are constantly culling their list in the face of their shoestring budgets.
Multiply that across other issue areas in California, and then across 49 other states, down to local governments, and up to the federal government.
This is the plucky state of our nascent reform movement.
Where Will The Resources Come From?
In the example above, we focused on the scant resources of the housing reform movement in California. But what about the status quo interests?
A common misconception for folks new to YIMBY politics is to imagine the opposition as just neighborhood NIMBYs. As we said earlier, status quo bias is a strong element of the human condition—there will always be individuals who oppose change. Our current system gives those individuals too much power to veto changes that would benefit the collective interest, but if individual NIMBYs were the only foes, we would be much farther along in resolving the California housing shortage.
Instead, as in many policy domains, in addition to individuals there are powerful entrenched interests with business models that rely on the status quo. In the case of California housing, organized interests like the construction trade unions,4 environmental groups, and "equity" groups block reforms that would unlock housing supply.
This problem replicates across many policy domains: Organized interests with business models that rely on the current system block change. So what is the ~business model of our reform movement? Where will the requisite resources—which we hope we’ve convinced you will need to be massive in scale—come from?5
Your Place in the Abundance Movement
Here’s the inconvenient answer: you. Yes, you, dear reader. After all, you have found your way to a tiny Substack on the vast internet and have made it through 1,600 words so far. This suggests you care about these issues, and the state of our nation, and the outcomes that generate unnecessary misery in the lives of our fellow citizens, and the instability it causes for all of us going forward, and the promise of a country that could be so much better if only we would have the will to make it so.
At the risk of overstepping, we’ll make some assumptions about you. You’re college educated. You’re ~liberal. You listen to Ezra Klein and Derek Thompson and have read Jen Pahlka and you want the politics they’re describing. The reality is, and again apologies for the inconvenience, you are the one who can make this politics real.
It is true that John & Laura Arnold have set up their Infrastructure Fund (Abundance by another name), ramping up investments in the space. It is true that Dustin Moskovitz and Patrick Collison among others have funded OpenPhil’s Abundance fund, a $40m+ annual effort. We’re sure other philanthropists will join the fray. And this philanthropic capital is critical.
But it is not enough. Philanthropic funds represent a small fraction of the resources necessary for this movement to succeed. To rely on philanthropy alone is also risky; philanthropists’ funding strategies change over time, and depending on a small handful of funders creates “customer concentration risk.” A truly impactful democratic movement requires a broad base of support; it should be built on a foundation of reform-minded citizens.
And those among us who have benefited most from the changes in society over the past 30 years—the transition from an industrial economy to a knowledge economy—should be leading the charge. There is an individualist (selfish?) streak in ~elite culture, where we’ve been told our success in this new economy is solely our own doing. And we have mainly abdicated our responsibility to contribute to the broad commons.
So what do we think it takes to *be* an Abundant? To move from being, in Eitan Hersh’s words, “political hobbyists” to “political actors”?6
We have to commit material resources—time, money, or both—to a reform effort. To quantify it, we think the threshold is something like an annual commitment of 1-2% of household income or 5-10 hours per week. This is the threshold to earn the title of an Abundant.
Where you invest those resources is a secondary question. Become an Abundance Network member, or contribute to the Niskanen Center, or to California YIMBY, or buy copies of Ezra & Derek’s book for all your friends, or support an Abundance-aligned political candidate, or educate & agitate your colleagues in whatever institution you work in.
The next phase of the Abundance Movement, a shift from op-eds to outcomes, is starting, and the key question is: what role will you play?
Thanks to Aston Motes, Brian Hanlon, Jen Pahlka, Jesse Wolfson, Monica Chellam, and Steve Teles for reviewing drafts of this post.
Plenty of advocates, legislators, and staffers still embrace old ways of thinking. But we've seen a lot of movement to our side since 2017.
For additional factors that are slowing production, see this tweet thread from CA YIMBY CEO Brian Hanlon.
It's also tiny relative to the relevant advocacy ecosystem. The vast majority of people who are employed by nonprofit advocacy groups in CA who take housing positions oppose market-rate homebuilding.
We explore this concept more in “Building the Ezra Faction.” (6 min)
In Eitan’s phrasing, “Political hobbyism is to public affairs what watching SportsCenter is to playing football.”
The Implementation column is missing from your spending table:
In CA there are 3 housing law enforcement non-profits: YIMBY Law, Ca Housing Defense Fund, Californians for Homeownership. In addition, Public Advocates, Pacific Legal, Institute for Justice, HAC and the BIA all spend some money on lawsuits to implement state housing laws. Also, some of our grassroots organizing is for implementation.
I don't know how important this is for your point, but YA spends $0 on PAC, not $320,000, the overall YA and YIMBY Law budget is not correct here and we spend 100% of our effort on housing.
I like the idea of this chart. lmk if you want to get together for better data.
Can you explain the methodology chart about housing reform spend? It seems like you're making a quantitative argument but at the same time you say it's a guesstimate, so I'm wondering how you ended up at 80% for groups like YIMBY Action and HAC? This doesn't really match my understanding of those groups so I'm wondering where the mismatch is.
I was trying to dig into this further and saw this article: https://jeremyl.substack.com/p/guide-to-californias-yimby-movement
It seems like the author is pretty familiar with the same groups you covered here, so I'd like to see how your methods compare to his.